

Data Science Interiew Q&A: Part I
Statistics and Probability


Image ref
In the previous article I wrote a list of Data Science interview questions. There were a few people who asked me for the answers, and I am writing a series of posts to cover those answers. This is the first such post, and will cover statistics and probability questions. For each question, I am giving some comments as to what I will expect from a candidate in case I ask these questions. Take these with a pinch of salt, as these are not universal. Depending on a candidate’s background and the role to which they apply, some of these questions are not even relevant. For example, an ML engineer may not need to know most of these questions while a Data Analyst may need be be familiar with majority of these concepts.
So, here are the questions:
You toss a coin 100 times. What is the probability of 40 heads?
Assuming the coin has a probability of p to get heads, the no:of heads you get follows a binomial distribution. The probability that you get r heads in n tosses is equal to
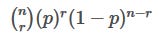
For given values of n and r, it takes following expression:
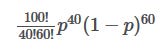
If the coin is unbiased, p will be 0.5
If I ask this question in an interview, I wouldn’t care if the candidate doesn’t remember this formula, but I would expect the candidate to be able to do two things: a) don’t jump to the conclusion that the coin has 50-50 chance of getting heads b) identify that the phenomenon comes from binomial distribution. If they get both these right, I would give them full credits for this question
You toss a coin 100 times. You observe 40 heads. What can you say about the coin?
There can be two objectives of this question - what is the expected value of the p from above question (probability of the coin returning heads), or testing the hypothesis that the coin is unbiased. I would be testing for the second one (first is easy, p=0.4).
Basically, you observed 40 heads out of 100, while the expected no:of heads for an unbiased coin is 50. Based on this, do you say the coin is biased?
We saw earlier that the coin comes from a binomial distribution. The variance for Binomial distribution is np(1-p), which is equal to 25 for p=0.5 and n=100. So standard deviation = sqrt(var) = 5. i.e., the observed value of 40 is two standard deviations below its expected value. This corresponds to a little over 95% confidence interval (z value for 0.95 is 1.96). So we can reject the null hypothesis that the coin is unbiased, with 95% confidence. Or we can say with 95% confidence that the coin is biased.
If I ask this question in an interview, I will see if the candidate is familiar with hypothesis testing, identifying what a null hypothesis is, and what confidence intervals are. If they give an approach till here, that’s enough for me. I might expect the candidate to be able to calculate the confidence intervals based on their past experience.
You have a stream of data coming. You need to do random sampling and maintain only k data points. What is your sampling strategy so that your sample is not biased?
The idea is that in your final sample, you have uniform representation of all the points observed so far, without a bias towards any subset such as early/recent samples. So how do we do it?
Let’s say you already observed n (>k) datapoints. For the n+1 point, you consider the point with probability k/(n+1). If the point gets selected, you then drop one of the existing k elements with equal probability. The proof that it selects all points with equal probability is based on induction, which I won’t cover here. But intuitively, it works like this: After n+1 points, each data point will have k/(n+1) probability to be part of the sample. This is same as the probability with which we picked our new point to be stored. Once a new point comes in, all of old sample points are treated equally hence one of them is dropped with uniform probability.
If I ask this question in an interview, I will basically see if the candidate is able to identify the problem with biases towards recent/early sample points. The sampling strategy is not too complicated and I would expect candidate to be able to come up with it. For the proof, I will probably expect if the candidate comes from some statistics background.
How do you compute the distribution of sum of two poisson distributions?
Disclaimer: I would never ask this question (unless I am taking interview for a statistics teacher).
Here’s the solution from stackexchange:
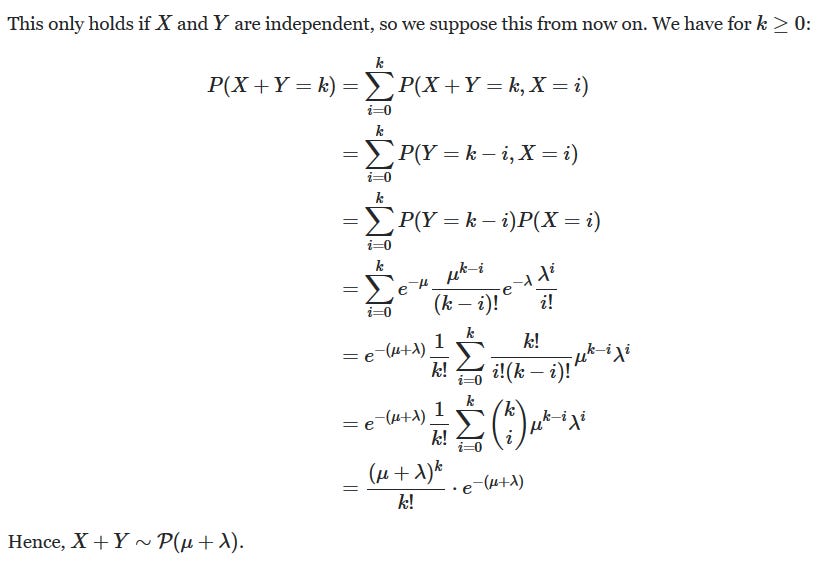
As I said, don’t worry about it from an interview point of view, but if you really like working with stats, check it out and derive yourselves just for the fun of it.
What is Normal Distribution? Why is it so special?
Because of Central Limit Theorem (see below), it is observed in many places.
If I ask this question in an interview, I would expect the candidate to atleast be familiar of something called as central limit theorem and its association with Normal Distribution.
Explain Central Limit Theorem.
The mean of a sufficiently large number n of i.i.d random variables that come from any distribution with finite mean 𝜇 and fininte variance 𝜎2, will follow a normal distribution with mean 𝜇 and variance (𝜎^2)/n
What makes this extremely important is that the underlying random variables can come from any distribution as long as it satisfies some basic conditions (finite mean and finite variance). That’s the reason why Normal Distribution is observed in many places - as a direct consequence of Central Limit Theorem.
If I ask this question in an interview, I would expect the candidate to atleast know the high level definition of it.
X, Y, Z are three uniform random variables. what is probability that max(X,Y) is > Z?
This can be reformulated as probability of Z being smallest of all three variables. It is equally likely for X, Y, and Z to be the smallest of the lot. So the probability is 1/3
If I ask this question in an interview, I expect the candidate to solve this. It is testing candidate’s familiarity with basic probability
Three numbers A, B, and C are drawn from uniform distribution. What is the probability that they will be in order i.e. A<=B<=C or A>=B>=C
This is essentially same as previous question. The conditions stated are met as long as B is not the minimum of the three. So probability is 1- 1/3 = 2/3
If I ask this question in an interview, I expect the candidate to solve this. It is testing candidate’s familiarity with basic probability
You play a game of (six-sided) dice where if you get a 6, you win. What is the average number of games you need to play before you win?
Assuming the dice to be fair, we get a (p =) 1/6 probability of winning a given game. The probability that you win in your first game itself is 1/6. Probability that you win in your second game = P(losing 1st game) * P(winning 2nd game) = 5/6 * 1/6. Similarly, P(winning in your nth game) = P(losing n-1 games) * P(winning nth game) = (5/6)^(n-1) * 1/6
So you get a probability distribution over x (=no:of games you need to play to win). You need the average (or expected value) of x over this distribution. This is given by the formula (from definition of expected value of a discrete random variable):


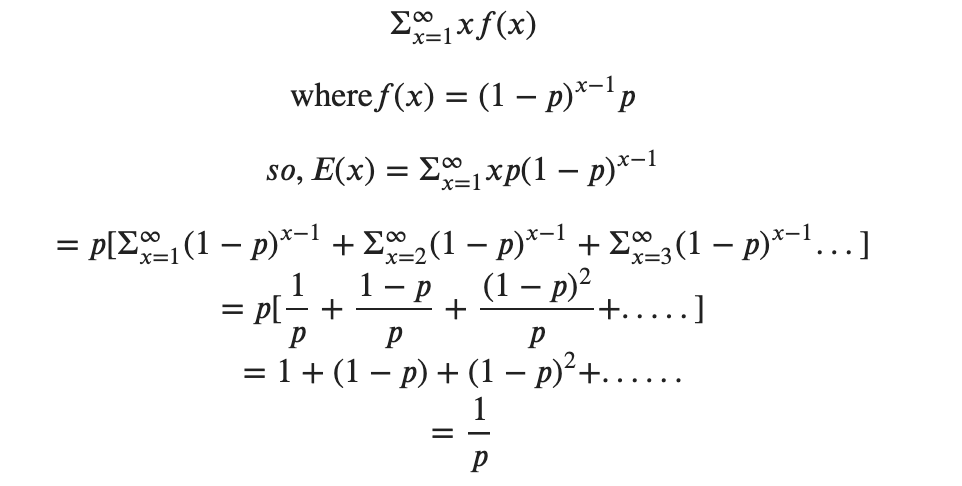
From the above derivation, we can see that the average no:of plays required before the first win will be 1/p or 1/(1/6) = 6; Therefore, you require 6 games on average to win your first game.
If I ask this question in an interview, I expect the candidate to be able to atleast identify the format of x (=p * (1-p)^x-1) and their understanding of computing mean of a random variable.
Closing remarks: Many times in an interview, an interviewer would ask questions based on their knowledge. And statistics as a field is vast. It would be very unfair to expect a candidate to know all the concepts in detail. But it will do a lot of help if a candidate is familiar with some basic concepts. These are as follows:
Calculating probability of an event
Understanding what a random variable is and how to calculate its mean and variance from its distribution
Familiarity with some basic distributions such as Normal Distribution, Bernoulli, Binomial, Geometric distributions etc.
Understanding Central Limit Theorem and its significance
Understanding the concept of confidence intervals, how to calculate them from mean and variance, their relation with hypothesis testing